Are you wondering how to choose the right list price in Fredericksburg without leaving money on the table? Pricing can feel tricky, especially with different neighborhoods, home ages, and buyer needs in play. You deserve a simple, local framework that gives you confidence and a clear plan. In this guide, you’ll learn how to build a strong CMA, use absorption rate, pick the right comps, and set price bands so your home shines where it counts. Let’s dive in.
What drives Fredericksburg prices
Fredericksburg draws commuters who value quick access to I‑95, US‑1, and VRE service. If your home offers easy access to trains or highways, that can widen your buyer pool. You also see steady demand from military and federal employees whose timelines can shift, so plan for timing flexibility.
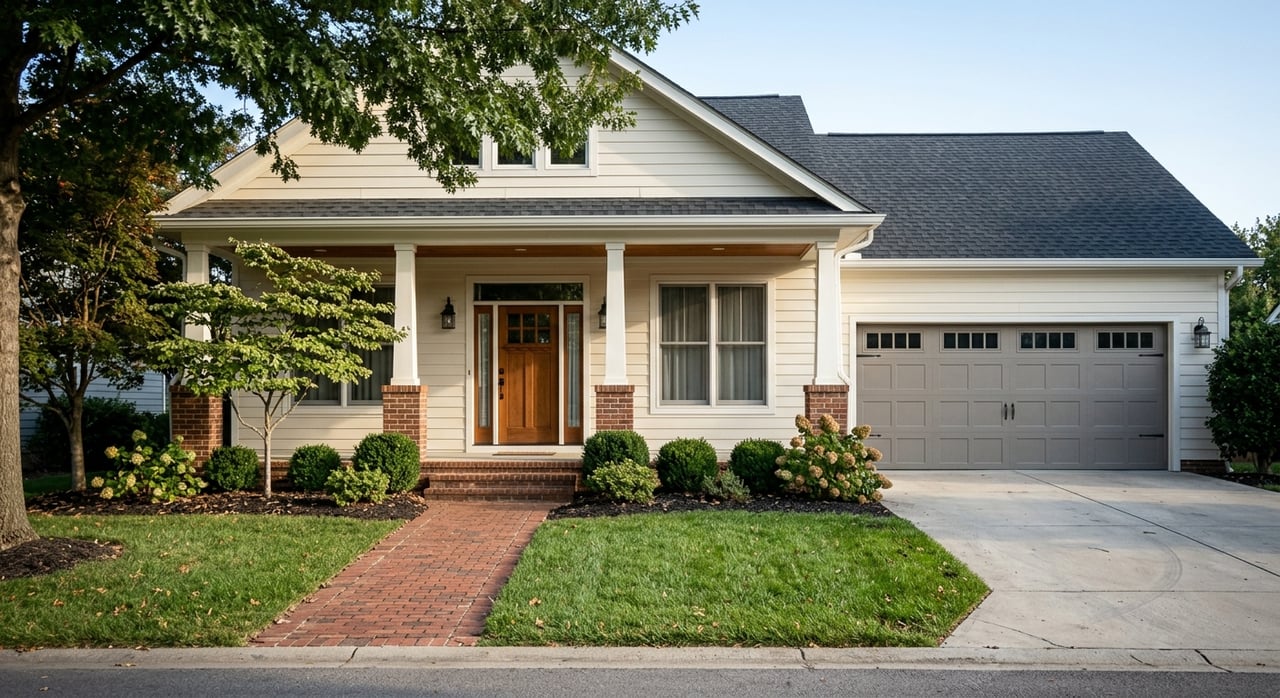
In Old Town and the Historic District, buyers often pay premiums for walkability, lot configuration, and preservation character. These are not always captured by simple price per square foot. Retirees and downsizers look for one-level living and low-maintenance options, including some newer and active‑adult communities.
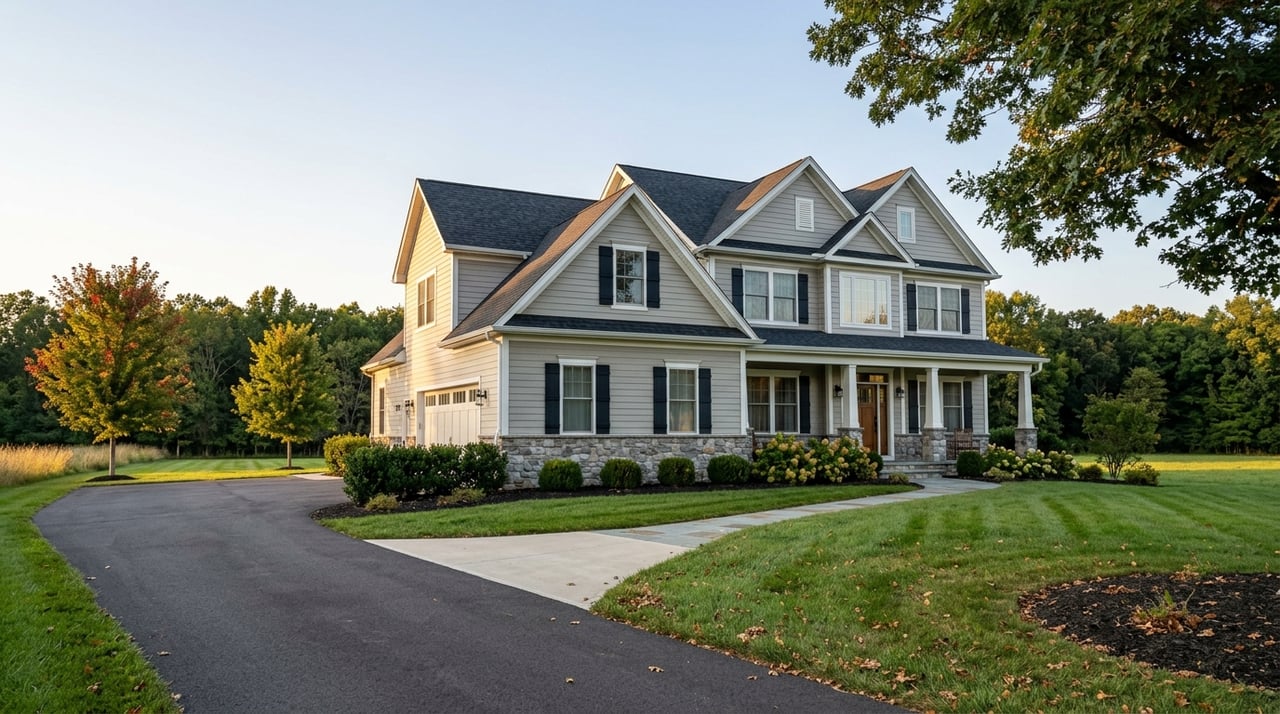
Local supply varies. You’ll find everything from historic downtown homes to newer HOA communities and townhomes. Age and floor plans differ widely, so condition and functional updates matter. If your property is near the Rappahannock or in a low‑lying area, check flood status and insurance implications using the FEMA Flood Map Service Center.
Regulations also shape value. Historic district rules can limit exterior changes and additions, which affects marketability and comps. HOA fees and covenants can change net monthly carry and should be reflected in pricing. For zoning and historic guidelines, review the City of Fredericksburg planning and zoning.
Seasonality follows national patterns. Spring typically brings more listings and buyers, with additional bursts around commuter and military move cycles. If you plan to list in 3–6 months, align prep with the spring window when possible.
Build a bulletproof CMA
A strong CMA starts with clear property facts and well‑chosen local comps. Focus on apples‑to‑apples comparisons inside your micro‑market first.
Core property attributes to capture
- Address and micro‑neighborhood (Old Town, Falmouth, Celebrate Virginia, Fall Hill, etc.)
- Property type, beds, baths, living area, lot size, and usable lot area
- Year built, major updates, and overall condition level
- Basement or finished lower level details, plus parking and garage
- Interior features that matter locally, like open plan, number of full baths, and primary suite location
- Exterior features such as porch, deck, fence, pool, river views, or historic facade
- HOA fee details and what is covered
- Proximity to VRE and I‑95, and school assignment boundaries
- Zoning or deed restrictions that affect use
Valuation metrics to calculate
- Price per finished living square foot, interpreted alongside floor plan and condition
- Days on market and sale-to-list ratio for similar homes
- Adjusted living area if basements or attics differ in finish
- Absorption rate or months of supply for your micro‑market and price band
Smart weighting for adjustments
- Location and micro‑market match: highest weight
- Property type and size/utility: high weight
- Condition and updates: moderate to high
- Lot size and special features: moderate
- Time of sale and HOA or parking differences: smaller but meaningful
Fredericksburg‑specific notes
- Use solds from the last 30–90 days when possible. In slower conditions, expand to 6–12 months and time‑adjust.
- In Old Town, weigh architectural style, lot shape, and preservation constraints more heavily.
- For commuter‑driven buyers, proximity to VRE and highways can outweigh modest size differences. See Virginia Railway Express schedules for context.
- If flood insurance is required, find recent local sales with similar exposure to quantify the adjustment.
Data quality checks
- Reconcile MLS and public record square footage.
- Verify actual sold prices and note any concessions.
- Exclude or footnote atypical conditions such as estate sales or foreclosures.
Absorption rate and your strategy
Absorption rate shows how quickly listings are selling. You can express it as a percentage of homes sold in the last 30 days compared with current actives, or as months of supply.
- Absorption rate (%) = homes sold in past 30 days ÷ active listings × 100
- Months of supply = active listings ÷ average monthly closed sales over 3 months
Low months of supply generally point to a seller’s market where you can price closer to the top of the comp range. A balanced market rewards accurate pricing. Higher supply calls for a more competitive list price and patience on DOM. To pull current local numbers by neighborhood and price range, use FAAR monthly market reports and Virginia REALTORS market summaries.
Hypothetical example only: If six similar homes sold in the past month in your segment and there are 12 active listings, the absorption rate is 50 percent and months of supply is about 2. That suggests stronger conditions, so you might position your price near the top of your comp‑supported range, especially if your condition and updates are superior.
Micro‑markets and comps that fit
Fredericksburg’s micro‑markets do not move in lockstep. Select comps by neighborhood boundaries and buyer profiles.
- Old Town and Historic District. Focus on nearby blocks with similar architecture and constraints. Floor plan uniqueness and preservation rules justify larger adjustments.
- Falmouth and river‑adjacent areas. Weigh water influence and floodplain status. Document any required elevation certificates or insurance.
- Fall Hill and Parkway corridors. Mid‑range single‑family homes with varied updates. Match beds, baths, and finished basements closely.
- Celebrate Virginia and HOA subdivisions. Include builder sales and recent resales. Incentives may set effective ceilings.
- VRE corridor townhomes and condo clusters. Treat townhomes and condos as distinct segments. Price per unit behavior differs from detached homes.
When building your CMA, prioritize 2–3 best solds from the last 90 days, add 2–3 active competitors, and include 1–2 expired or withdrawn listings to understand price ceilings. Expand the radius for unique or high‑end homes and record your rationale.
Price‑banding that works
Price bands group homes into ranges that buyers actually search. Most buyers set a price slider and rarely cross bands unless the value is compelling.
How to set your bands:
- Pull 3 months of actives and solds in your micro‑market.
- Look for natural gaps where inventory thins or housing type shifts.
- Use narrower bands in lower price ranges, and wider bands as prices increase.
- For unique Old Town homes, create a bespoke band rather than forcing a fit.
How to use bands:
- Compare your list price to actives inside the same band first.
- If you are at the low end of a band, pricing just below the midpoint can pull in buyers from the band below and above.
- Monitor your band weekly. If new competition appears, adjust quickly.
Hypothetical banding illustration only: $300–350k might be townhome‑heavy, $350–425k could be entry detached, $425–525k often captures move‑up detached, while $525k+ includes premium or historic properties. Always tailor the ranges to your actual inventory pull.
3–6 month pre‑listing checklist
- Gather documents: deed, survey, tax assessment, utility bills, HOA info, and receipts for improvements.
- Consider a pre‑listing home inspection so you can budget and address items that affect value.
- For complex properties, order an appraisal or broker price opinion early.
- Identify 6–10 target comps now and schedule a CMA refresh within 30–60 days of listing.
- Complete small repairs and cosmetic updates that change a buyer’s first impression.
- Confirm flood zone status and estimated insurance if you are near the river using the FEMA Flood Map Service Center.
Once active, recalculate absorption and check competitor listings every week for the first 2–4 weeks. Reprice if showings lag local norms or if you have no offers after a reasonable window for your market speed.
Quick worked example
This sample is illustrative only and not a substitute for a fresh CMA. Imagine a 3‑bed, 2‑bath detached home in Fall Hill with 1,900 finished square feet, a one‑car garage, and modest updates.
- Best sold comps. Three recent solds inside Fall Hill or adjacent corridors within 1 mile, all 1,750–2,050 square feet, updated kitchens, similar lots. Adjustments made for one extra bath and a finished basement in one comp.
- Active competition. Two nearby actives at slightly higher prices with newer roofs and one with a larger lot, plus one townhome that is excluded from the primary comp set.
- Absorption snapshot. In the band where these homes compete, a 2–3 month supply points to moderate seller leverage.
- Pricing plan. List near the top of the sold range if your home’s updates outshine the actives. If your finishes are mid‑pack, price close to the middle of the range to attract both on‑band and cross‑band buyers. Refresh the CMA within 30 days of launch.
Avoid common mistakes
- Relying on citywide averages to price an Old Town or river‑adjacent property.
- Using price per square foot without adjusting for floor plan, condition, and lot utility.
- Ignoring HOA fees, flood insurance, or parking when comparing monthly carry.
- Letting out‑of‑date comps drive your price in a changing market.
- Skipping expired and withdrawn listings that reveal price ceilings.
Ready to price with confidence
You can price your Fredericksburg home with clarity when you ground your plan in a strong CMA, micro‑market comps, absorption rate, and practical price bands. If you want a calm, concierge experience that blends pricing expertise with hands‑on support, connect with Michelle Nicely to craft a tailored plan for your address.
FAQs
What is a CMA and why it matters in Fredericksburg
- A CMA compares your home to recent solds, current actives, and expired listings within your micro‑market so you can set a price that matches local buyer behavior and inventory.
How do I calculate absorption rate for my area
- Divide recent monthly sales by current active listings or compute months of supply, then use FAAR monthly market reports to pull the right neighborhood and price‑band data.
How many comps should I use in my CMA
- Target 3–6 recent solds, 2–4 active or pending listings, and 1–2 expireds for price ceilings, prioritizing the closest micro‑market matches.
Should I price under market to spark multiple offers
- It depends on months of supply in your price band; in low supply, a slight under‑ask can work, while in balanced or high supply, underpricing risks lowering net proceeds.
How often should I refresh my CMA before listing
- Update it within 30 days of listing and again right before you go live, then re‑run if new comps appear or the market shifts.
Do flood zones affect value and how do I verify
- Flood insurance requirements can impact pricing and buyer pools; verify status and likely costs using the FEMA Flood Map Service Center and consult your insurer.